Background
For non-developers (operations/planning) to check key metrics, they had to request them from developers every time.
Quick metric checks required a self-service dashboard, and over time this expanded into researching a statistics architecture that went beyond simple query sharing.
Outcomes
- Enabled non-developers to check key metrics directly through Redash-based dashboards
- Consolidated frequently-used queries and lookup patterns for operations/planning teams
- Researched a scalable statistics architecture considering the data model, aggregation methods, query performance, and operational convenience
Details
Redash-based monitoring setup
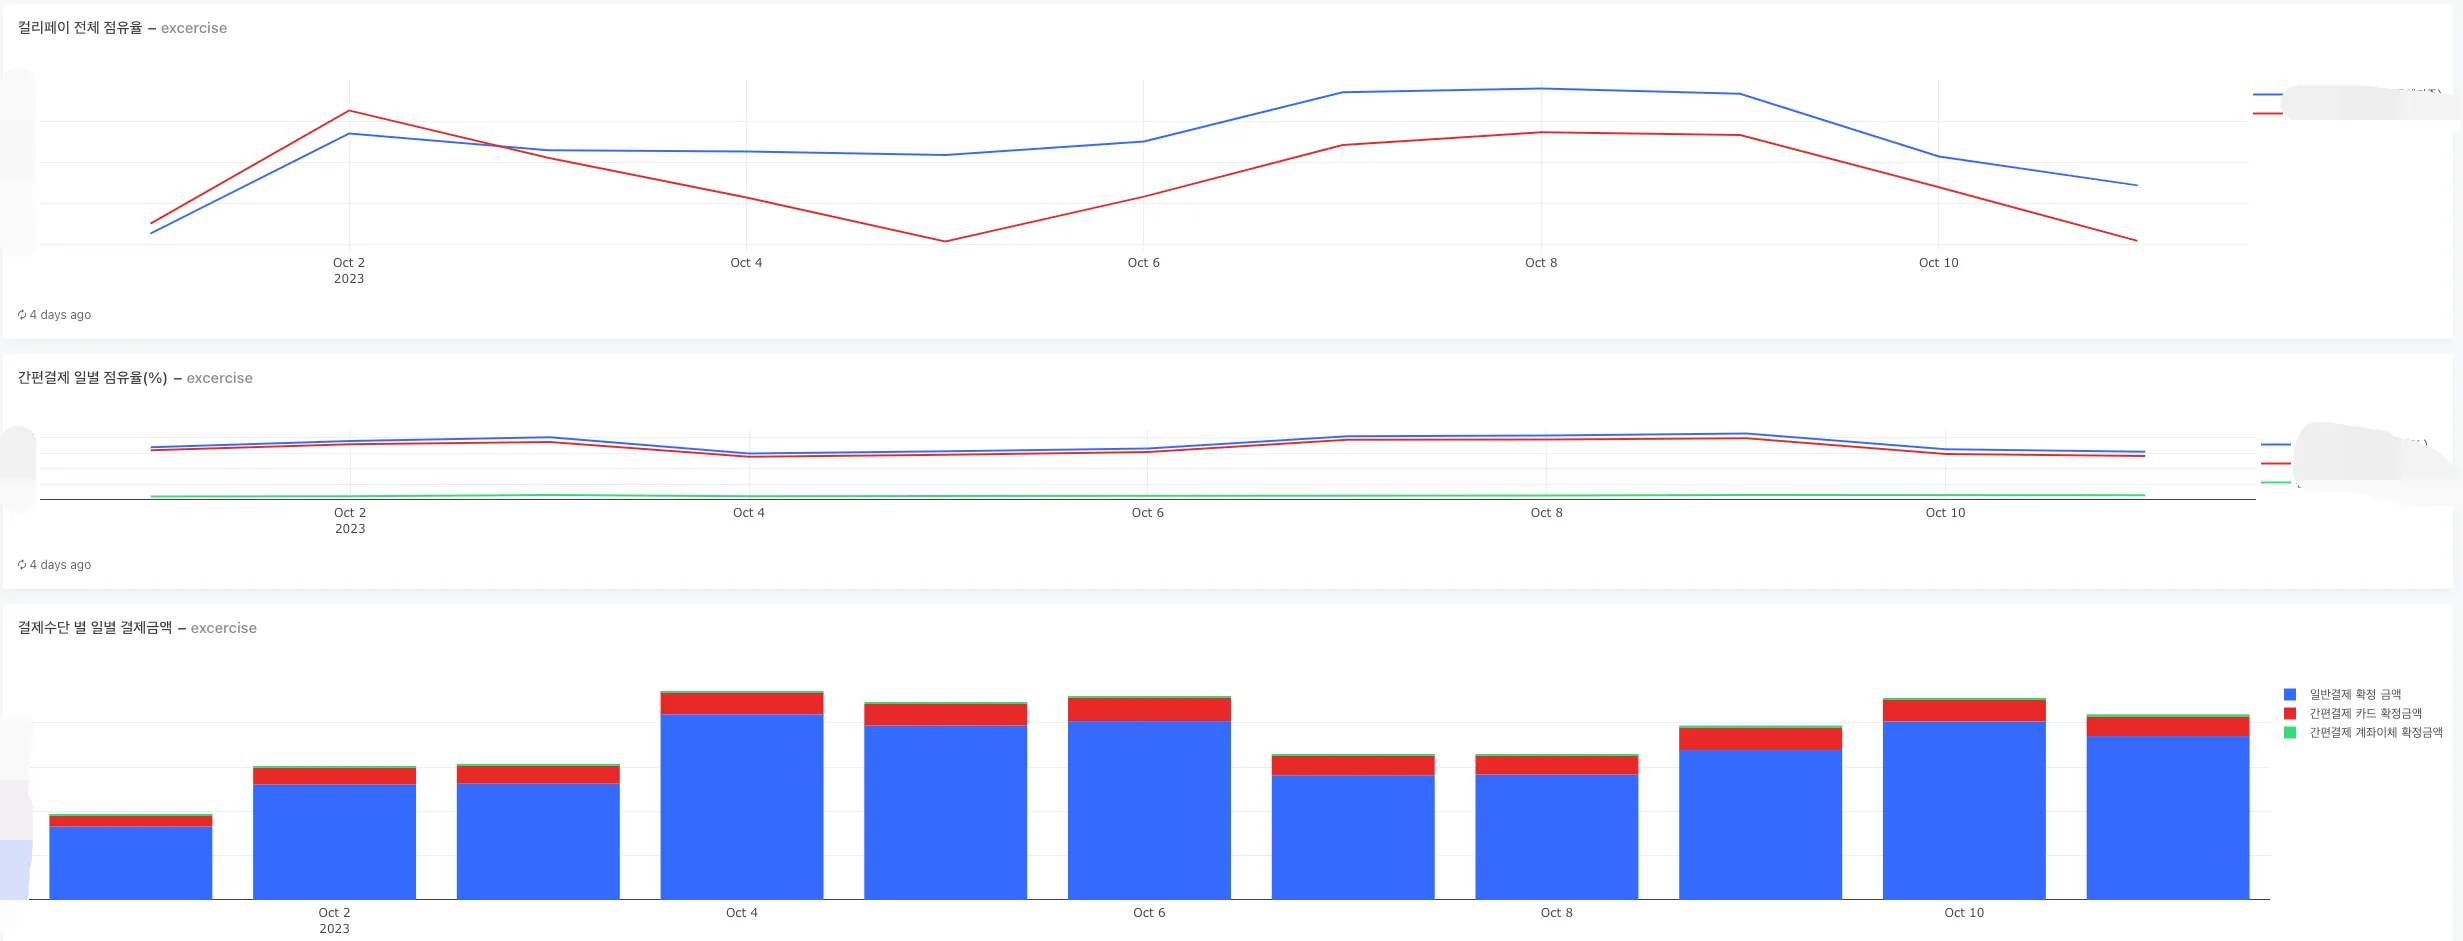
Redash chart showing payment method breakdown and share.
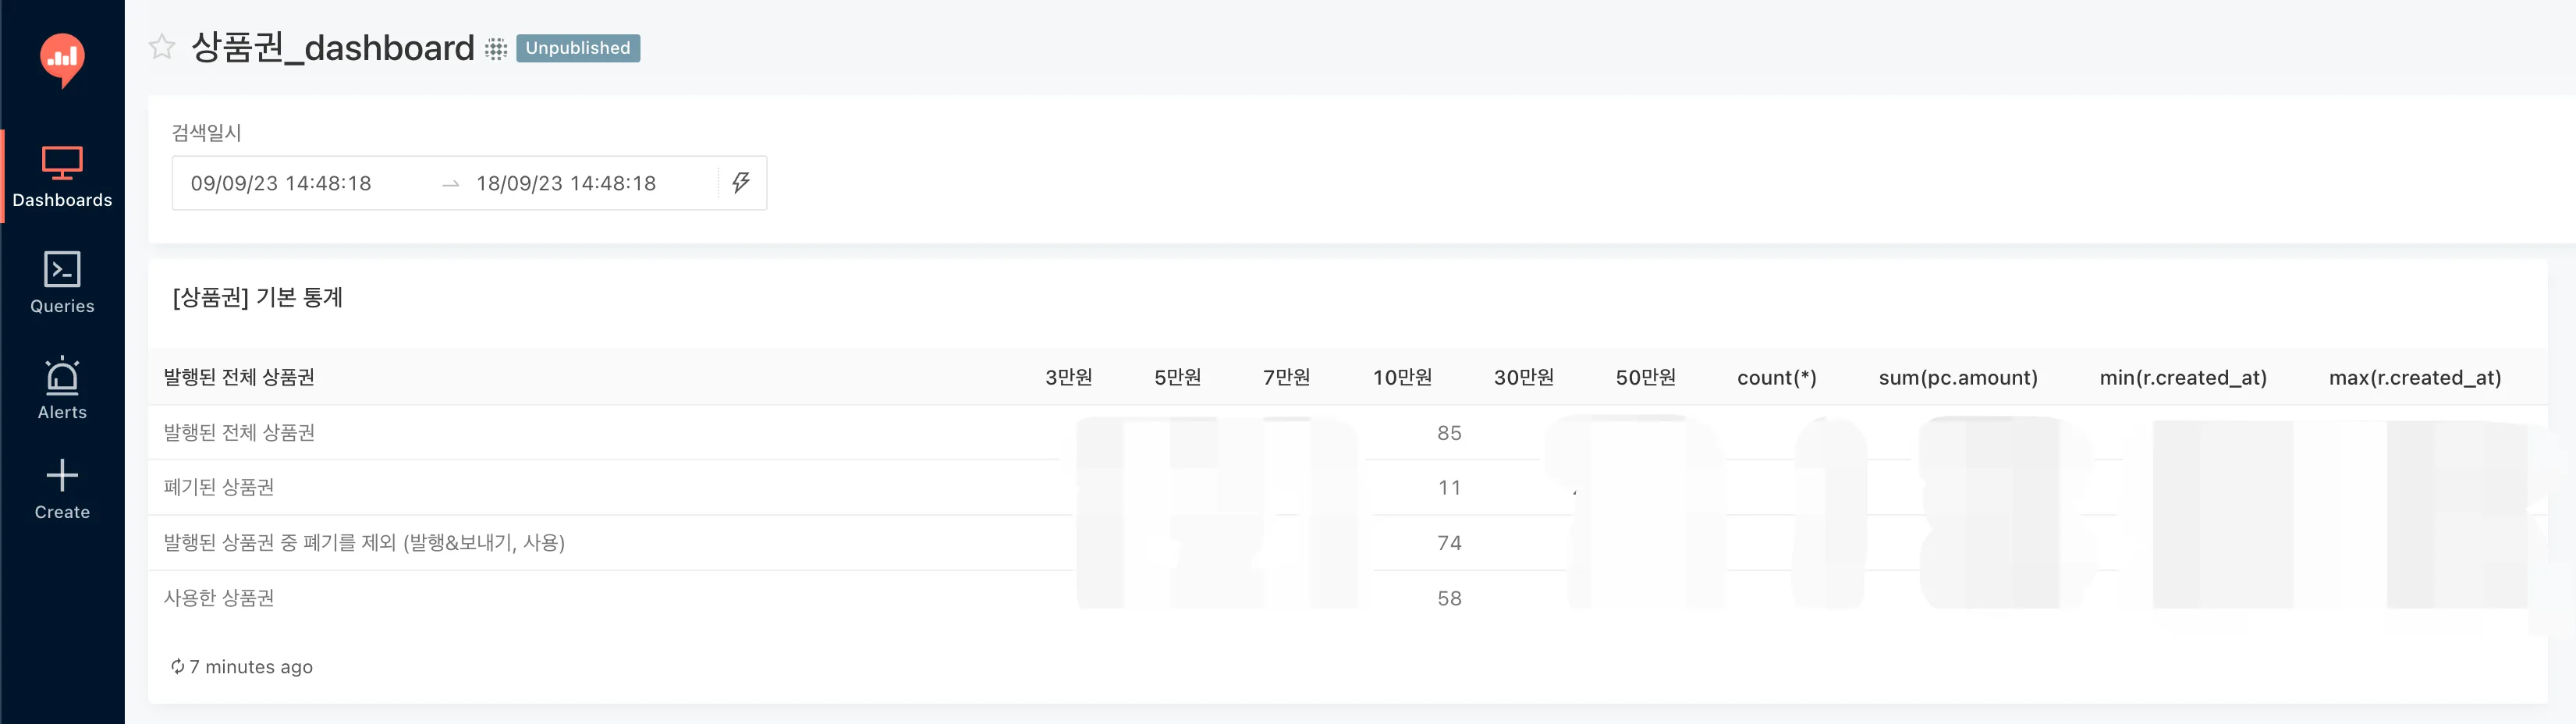
Redash dashboard of basic gift card statistics for operations.
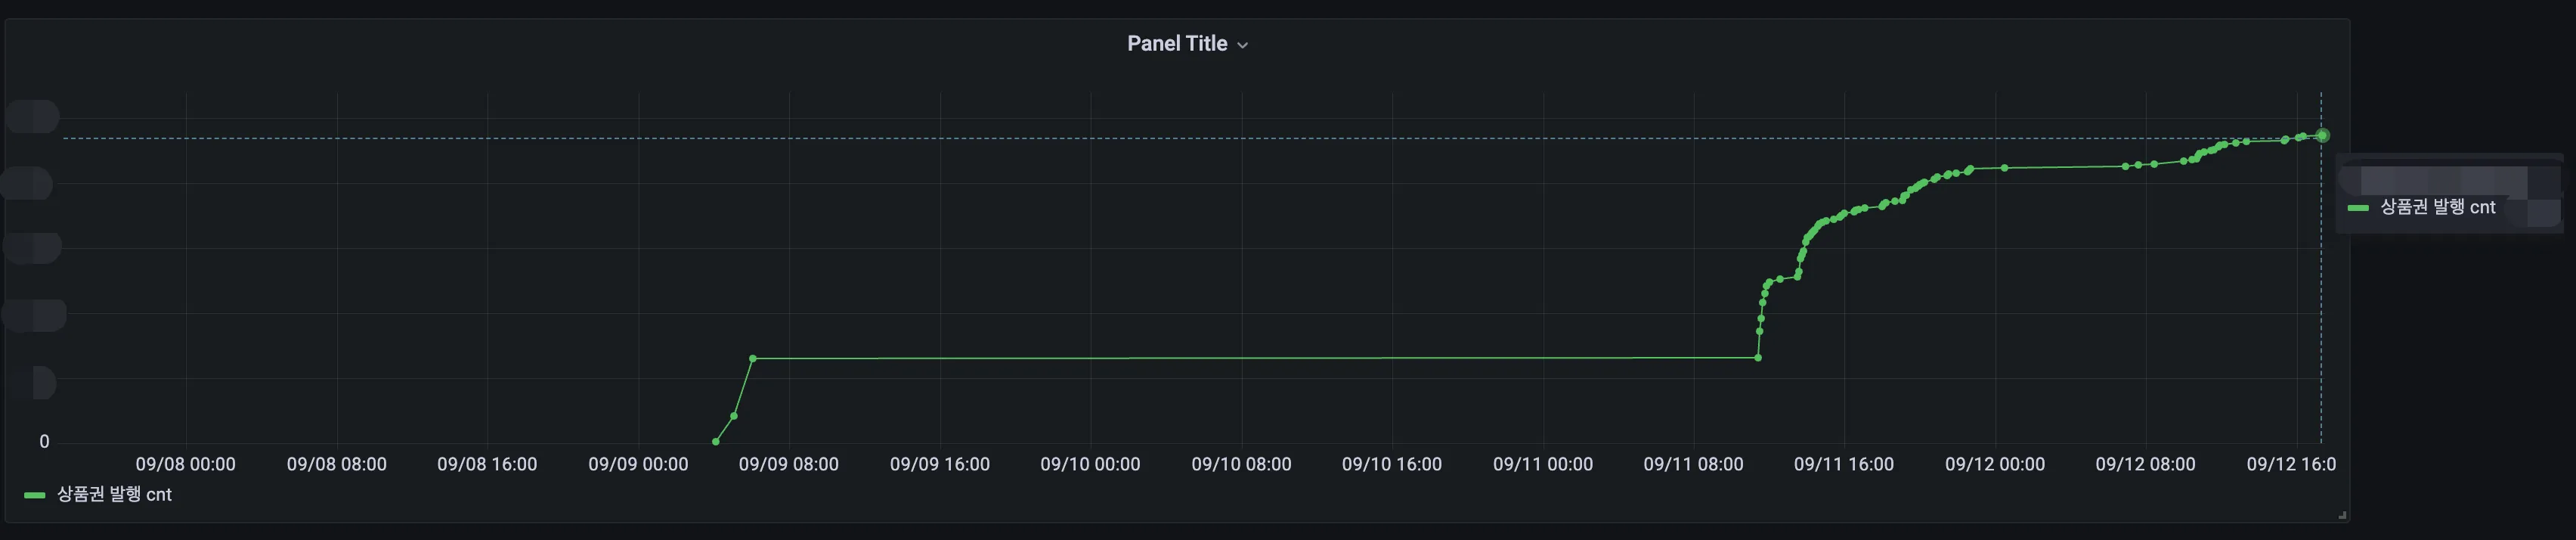
Time-series graph tracking gift card issuance over time.
Research into scalable data statistics
Building on hands-on Redash operations, researched a scalable statistics architecture covering the data model, aggregation methods, query performance, and operational convenience.
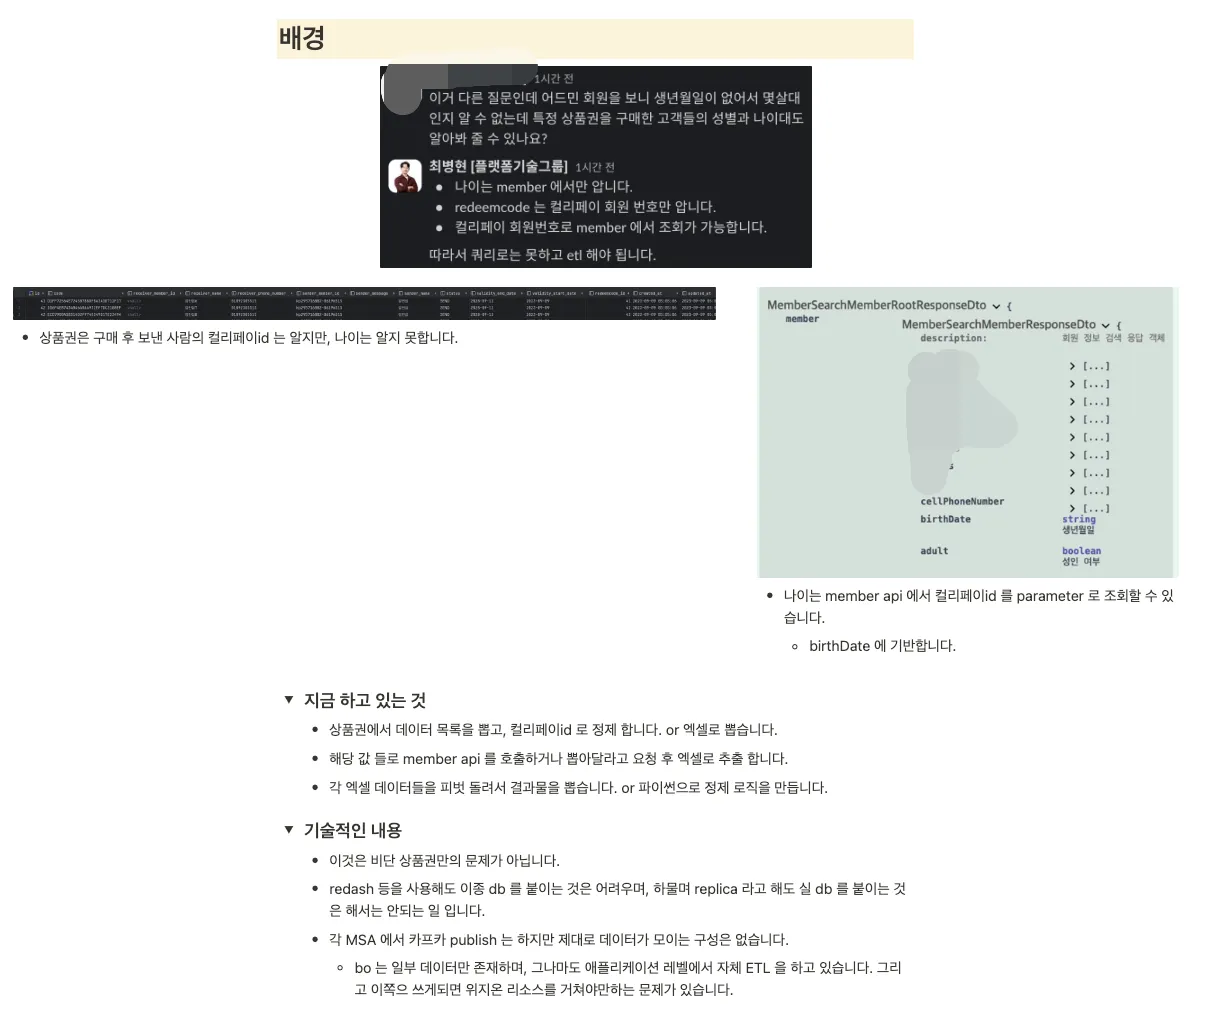
Background discussion summarizing the existing query-sharing approach.
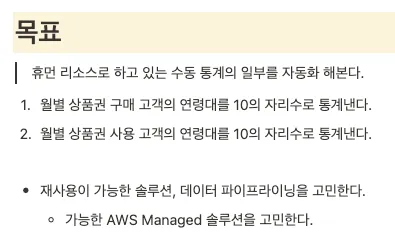
Goal definition for the statistics to be automated.
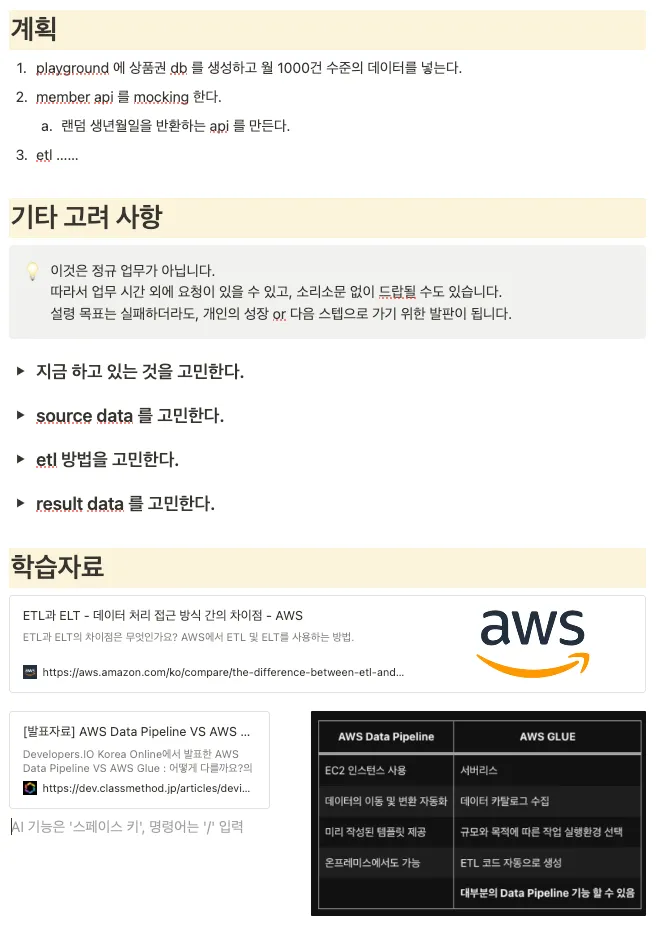
Plan studying ETL/ELT and AWS Pipeline for scalable statistics.